Home sales in Canada edged up slightly between November and December, a trend not often seen at the tail end of a calendar year.
CREA is releasing national statistics for December 2022, and while there are no surprises, there are reasons to pay attention to the data.
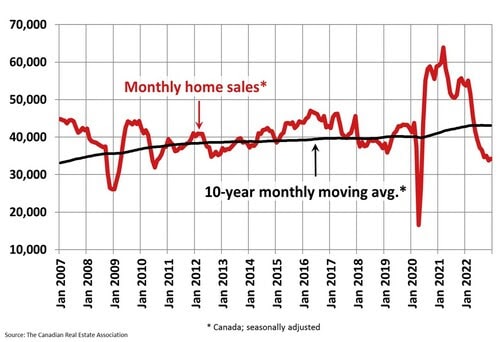
Chart A

Monthly home sales (Canadian Real Estate Association)
There’s a subtle trend when looking at Chart A from the national association. The Canadian real estate market responds to uncertainty by slowing down.
You can see notable drops in volume in 2009 and 2020 during periods of economic uncertainty, similar to the drop we’re seeing today. In both cases, volume returned swiftly after a slowdown and traded well above the 10-year average for a while thereafter.
This type of rebound typically rewards the more resilient professionals who can ride out the bottom of the market without knowing how long that may be. CREA anticipates a rebound in volume will take place in 2024.
Sales volume
Sales volume was down nearly 40 per cent compared to December 2021. While this appears alarming at face value, it becomes less concerning when considering that December 2021 was a record year.
Monthly volume increased 1.3 per cent compared to November, remaining relatively consistent after a steep drop in 2022. The uptick is notable because volume almost always drops off into December & January.
This break from the typical annual trend indicates a bit of strength and opportunism returning to the market after a months-long lull, and likely a result of buyers who were pushed out of the market by high prices slowly beginning to re-enter.
Anecdotes from the market support this opportunistic thesis, as many professionals mention having buyers who are waiting on the sidelines for the right time to purchase.
The market has been stripped of urgency and has returned to a slower, steadier, and healthier market that is focused on one factor: affordability.
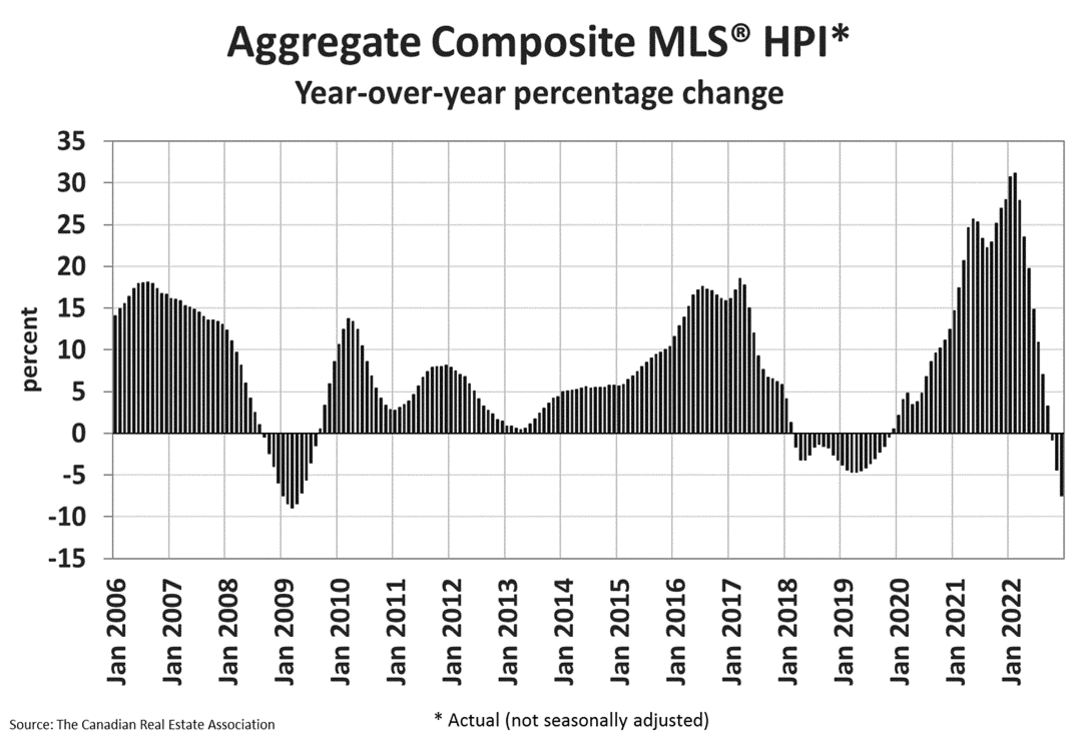
Chart B

When considering affordability, it’s important to note that most economists measure it as a function of a few variables:
· House prices
· Interest rates
· Income
National Bank noted in their Q3 Housing Affordability Monitor that housing affordability had reached levels not seen since 1981 and 1989.
Both previous peaks were followed by steep recoils in affordability as prices corrected and rates eventually normalized.
Income is expected to be largely unchanged as the Bank of Canada made job vacancies one of their primary targets in reducing inflation. This means that prices or interest rates must come down for the market to be sustainably affordable.
House prices are showing the largest year-over-year decline since 2009, with national home prices down 12 per cent year-over-year in December.
Finally, reviewing regional benchmark prices, a clear re-urbanization of demand is apparent. With the reopening of the workplace and travel, core markets seem to be more resilient than their surrounding suburbs.
Many of the municipalities that saw steep accelerations in price during the pandemic era are seeing comparably steep declines thereafter.
Read CREA’s housing market report for December here.

Daniel Foch is a real estate broker, working in the real estate industry for over 15 years with various notable organizations such as Interrent REIT, CBRE, and Hydro One. Daniel and his team have transacted over $250M in real estate across a variety of asset classes. During his academic career, Daniel was an active instructor, contributor and researcher in the University of Guelph’s Real Estate Faculty, founder of The University’s International URECC event, and was awarded for affordable housing innovation by CMHC & The University of Guelph during his tenure at the university.
Daniel is a regular contributor in the Canadian media as one of the most trusted, unbiased, and balanced sources of real estate insight. As a result, his real estate expertise has been featured in The Wall Street Journal, CBC, BNN Bloomberg, and The Globe and Mail, among others. Daniel has built a captive audience of over 100,000 real estate investors across multiple social media platforms by providing primary research and market analysis.


This article “Nails it”
Well written, easily understood and adds some optimism to what lies ahead, although it will take some time…..signs point in the right direction!
Thank you Lori!!
A really well-written and based-on-facts piece.
I will use it, with your permission and credentials obviously, while presenting the real estate situation to my clients.
Thanks Bogdan! By all means – feel free to share!
Well written. Good info for everybody to take informed decisions. I will use it too with your permission.
Of course – feel free to use it – thanks for asking Jagz.
Reviewing the full version of the CREA report showed
Volume decreased $5.5 Billion from November to December.
That was a drop that way larger than both 2008 and 2009.
It is important all agents do not believe the market got busier in December.
I encourage all realtors to fact check the full report we have access to.
Are you referring to the report realtors can download through statscentre.crea.ca ?
I’m looking at the report right now and it shows dollar volume at 22,902.6 in November and 23,223.5 in December for all asset classes, and 21,923.7 in November and 22,351.4 in December for residential.
Please let me know which page I can find the data points you’re referencing.
Someone in my office commented the heading on this article was also wrong.
Sales Declined in December over November they did NOT edge up slightly as stated.
Sales Declined over 8000 sales compared to November.
I think the author confused the consumer version of the report with the realtor only version.
I believe at this time (with many renewals coming due for annual fees) we are clear in just how bad the road ahead is for our business.
Feel free to send me the report or directions on how to access the data you’re referring to and I am happy to make a correction.
This report references the data that CREA sends to the media to report on – and I confirmed the data points support the highlights they provide. However, I understand they do use a selection of boards for that data.
Are you referring to the report realtors can download through statscentre.crea.ca ?
I’m looking at the report right now and it shows dollar volume at 22,902.6 in November and 23,223.5 in December for all asset classes, and 21,923.7 in November and 22,351.4 in December for residential.
Please let me know which page I can find the data points you’re referencing.