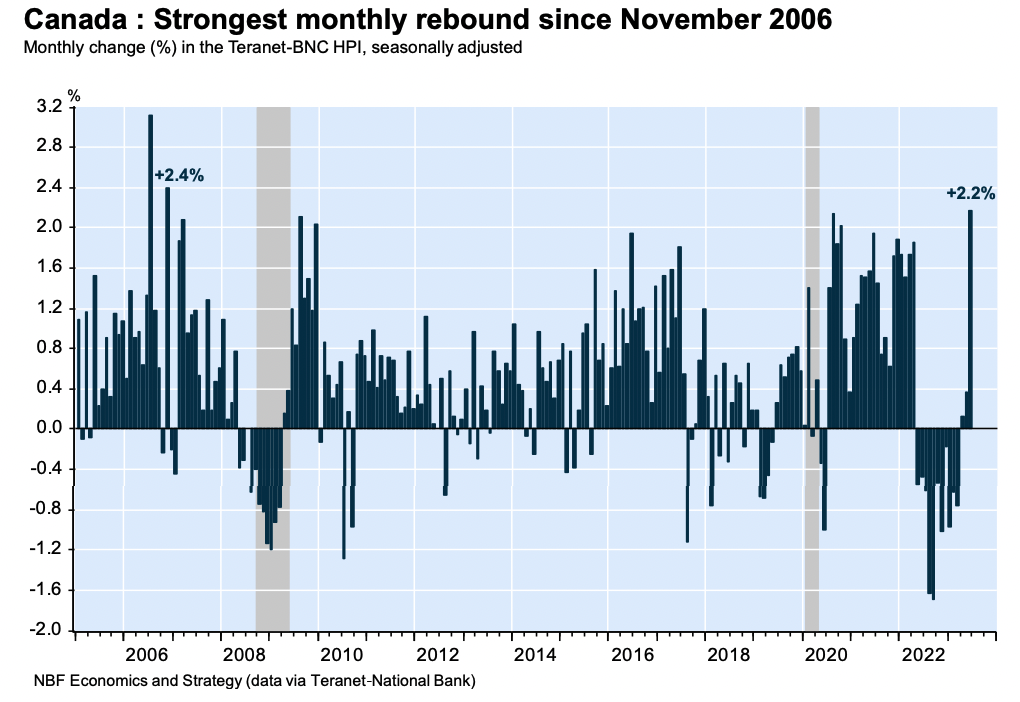
The Teranet-National Bank Composite House Price Index (HPI) jumped 2.2 per cent in June, marking not only the third consecutive monthly rise but also the most significant price jump in a single month since November 2006.
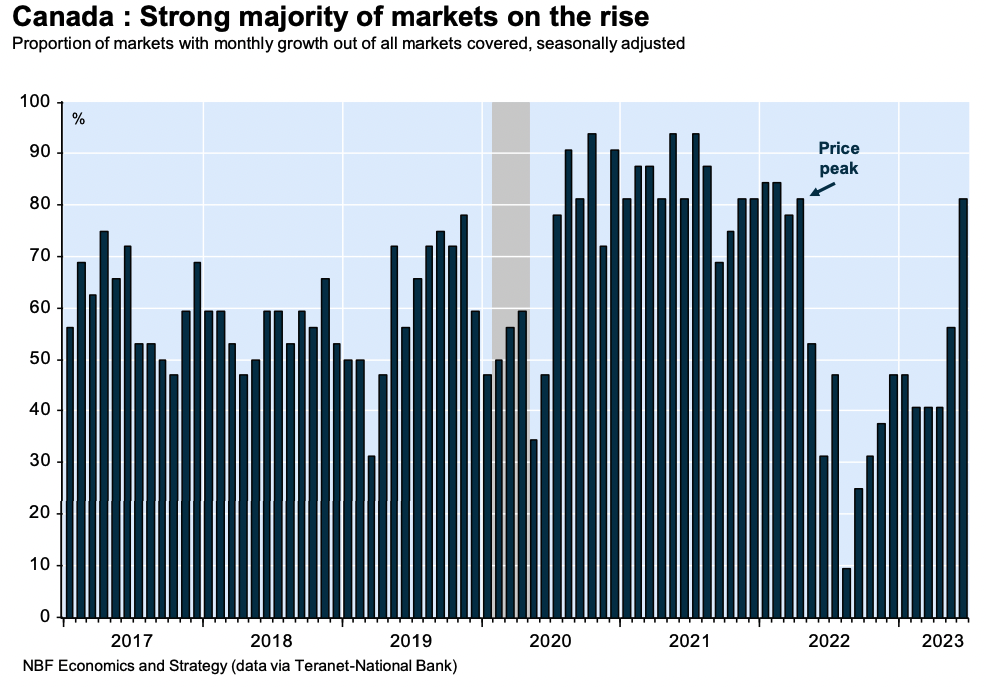
Broad-based growth: 81% of cities see housing price increases in June
The housing price rebound has been widespread across the country, with a 81 per cent of cities covered by the Teranet-National Bank HPI experiencing price increases in June.

Darren King, an investment advisor with National Bank, referred to the spike as “spectacular” in the July memo, writing, “After a cumulative decline of 8.7 per cent since peaking in April 2022, recent rises in the composite index have erased part of this correction, which now stands at just 6.2 per cent.”
Potential challenges ahead: Rate hikes and economic weakness could impact future prices
Before seasonal adjustments, the index rose 2.6 per cent from May to June, marking the fourth consecutive monthly increase. After accounting for seasonal effects, the 2.2 per cent rise in June is significant and demonstrates a steady upward trajectory for the housing market.
Looking at specific cities, Toronto and Vancouver led the way with notable increases of 2.9 per cent and 2.6 per cent, respectively. Other major cities, such as Quebec City, Halifax, and Calgary, also saw healthy price rises in the range of 2.1 per cent to 2.6 per cent. Winnipeg experienced a slight decrease of 0.2 per cent, while Hamilton’s prices remained stable.

Year-over-year
From June 2022 to June 2023, the Teranet-National Bank Composite House Price Index experienced an overall contraction of 5.1 per cent, a smaller decline compared to the previous month.
Among the cities included in the composite index, Calgary exhibited the most significant year-over-year price increase with a 6.5 per cent gain. Quebec City and Edmonton also registered positive year-on-year growth with increases of 5.2 per cent and 1.3 per cent, respectively. However, Hamilton, Ottawa-Gatineau, and Toronto faced the steepest declines at -13.4 per cent, -8.4 per cent, and -6.7 per cent, respectively.
Outside of the composite index, other cities have seen mixed results. Some markets, such as Trois-Rivières, Lethbridge, and Sherbrooke, recorded annual gains, while others like St. Catharines, Brantford, Abbotsford-Mission, and Peterborough experienced price declines.
Potential challenges ahead
It’s important to note the Teranet-National Bank Composite HPI is based on closed transactions — so it typically lags behind the market; experts caution that potential challenges may lie ahead.
King writes, “While prices could continue to be supported by strong demographic growth and the lack of supply of properties on the market, and continue to rise in the third quarter, the Bank of Canada’s recent rate hikes and the economic weakness expected in subsequent quarters will represent a headwind for house prices thereafter.”


FYI this excellent Case-Schiller style of comparing same-address properties after the closing of the sales, is only lagged by about 3-4 months from the “as arranged” sales and prices that Registrants use.
Ie their July report describes buying decision in March
It is an aggregate of sales from Jan-Jun (the odd Nov/Dec) that TNB claims closed in June.
The aggregation increases the closer you get to June and of course it includes more high priced homes in June as a result increasing the change recorded overall for June.
Since over 90% of the sales that closed had used a real estate brokerage to record the sale originally months before the result is that it equals change in MLS price by 100% since 2005 when a small time adjustment is applied that varies in length based on the month being reported on (common sold-buy-sold-buy-sold-buy pattern).
It is a great tool for selling agents to reinforce higher listing prices knowing you can claim it is independent but at the same time know it is just repeating what your local board reported months ago but in aggregate.
I would not use it of course for a client in a BRA as that would be misleading without an extensive educating of the client that even when completed is hard to be sure they understood. (ie don’t waste the time).
3-4 months is a long time in real estate so it does not accurately reflect the state of the current market.
I don’t see any reason to celebrate increased prices. If first time buyers cannot enter the market, it’s just a matter of time until market stagnates and starts falling
There are many ways to use data. Headlines are designed to grab the reader. This article really tells me nothing as a Real Estate Sales Rep. I analyze my own markets anyways.
Never really understood what “seasonally adjusted” really means or indicates.