


The Greater Toronto Area (GTA) experienced a slight decline in housing market competitiveness last month as the intensity of the spring market subsided.
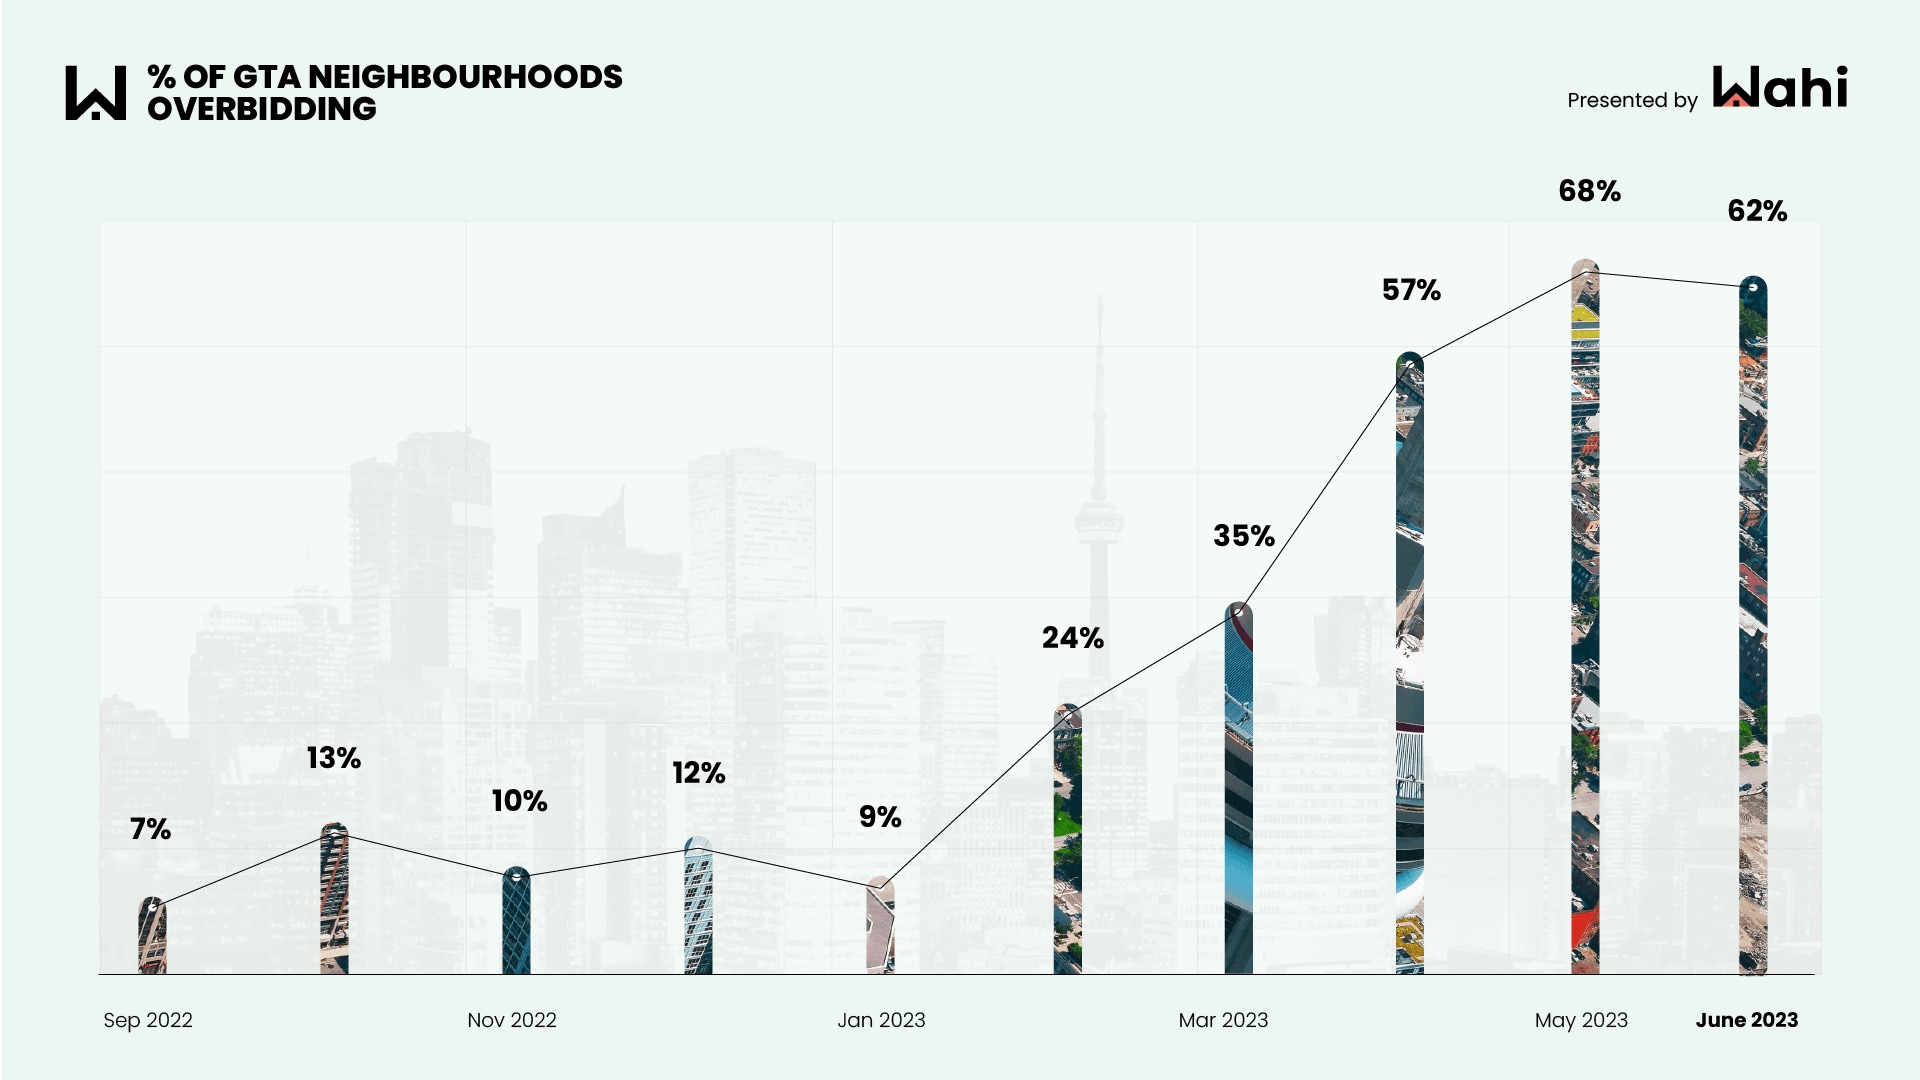
A recent analysis by Wahi shows 62 per cent of GTA neighborhoods were in overbidding territory in June, down from 68 per cent in May.
In June, 203 out of 326 neighbourhoods in the GTA experienced overbidding, a decrease from the previous month’s 222 neighbourhoods. This decline represents the first month-over-month decrease since January. During that month, only nine per cent of neighbourhoods were in overbidding territory, down from 12 per cent in December 2022.
Source: Wahi
The top 5 overbidding neighbourhoods in June 2023*
| Neighbourhood | Overbid (%) | Median overbid amount ($) | Median sold price |
| 1. Victoria Square, Markham | +26% | +$322,100 | $1,600,000 |
| 2. Broadview North, Toronto | +23% | +$276,000 | $1,500,000 |
| 3. Berczy Village, Markham | +19% | +$270,001 | $1,550,000 |
| 4. Bickford Park, Toronto | +19% | +$235,500 | $1,509,444 |
| 5. Rouge Woods, Richmond Hill | +18% | +$252,400 | $1,647,500 |
*Neighbourhoods are ranked according to calculations based on percentage changes between list and sale prices
The top 5 underbidding neighbourhoods in June 2023
| Neighbourhood | Underbid % | Median underbid amount | Median sold price |
| 1. Summerhill, Toronto | -10% | -$195,000 | $2,175,000 |
| 2. Southwest Oakville | -5% | -$159,400 | $2,837,500 |
| 3. Chaplin Estates, Toronto | -4% | -$95,000 | $2,300,000 |
| 4. Eastlake, Oakeville | -3% | -$96,200 | $2,650,000 |
| 5. King, York region | -3% | -$59,000 | $1,957,860 |
Wahi determines overbidding and underbidding neighbourhoods by comparing the differences between list and sold prices for all types of homes, excluding neighbourhoods with fewer than five transactions in a month. The analysis covers both condo units and houses, providing a comprehensive view of market trends.


NOW, we need a metric (or human) to determine if the OVER-bidding is a function of the Listing Stratagem of UNDER-Listing the Price and Holding-offers until a future date for bidding