For the first time in over a year, the primary measure of Canadian house prices has stopped falling.
When measured by the aggregate composite house price index (HPI), the average Canadian house price is $686,371, 13.7 per cent below March of last year but up since the beginning of the year.
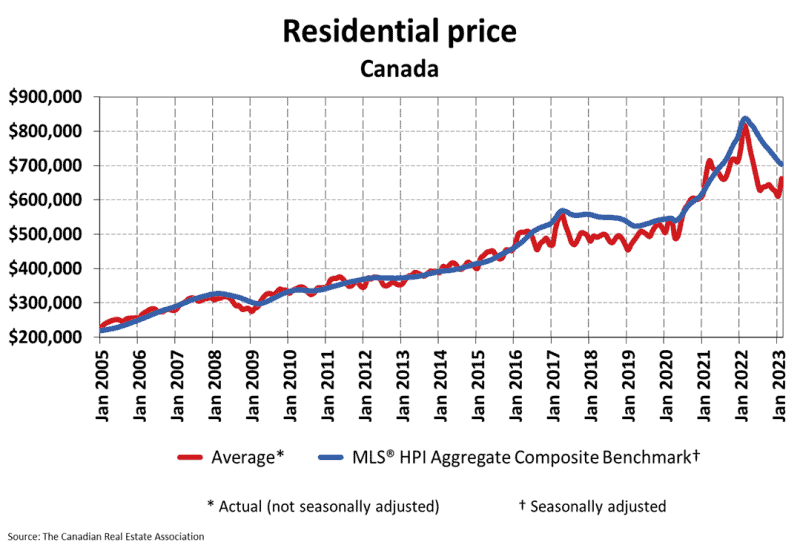
Monthly declines are still visible in many markets across the country, and the national average seems to be heavily supported by Toronto, Canada’s largest real estate market, where seasonal price growth has been exceptionally strong heading into the spring market, with the HPI up 1.6 per cent month-over-month.
WE’RE BACK BABY!
How do we all feel about this? pic.twitter.com/QUY7STvyFS
— Ben Rabidoux (@BenRabidoux) April 14, 2023
Growth was further supported by a handful of other Canadian markets that outperformed Toronto:
- Quebec CMA: + 3.6 per cent
- Sudbury: + 3.1 per cent
- Oakville-Milton: + 2.1 per cent
- Estrie: + 1.8 per cent
As mentioned in my most recent Toronto market update, I think it’s important to note the role of seasonal pricing in Toronto’s spring market, which this year’s growth epitomizes.
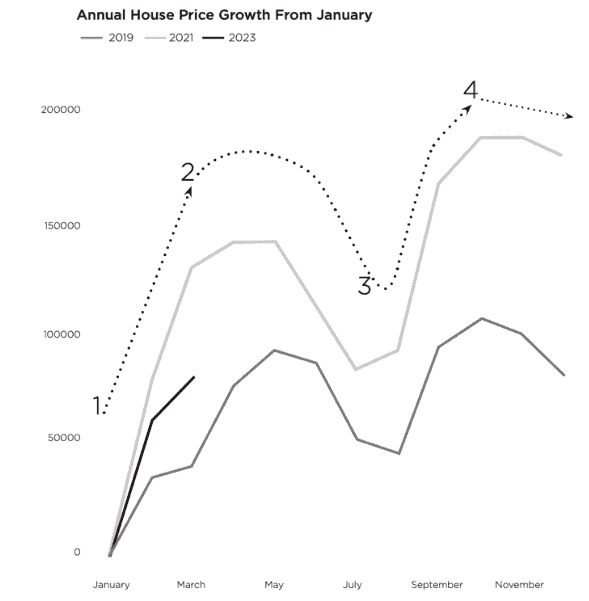
Annual house price growth in Toronto from January, source: Daniel Foch
Prices always follow a similar pattern in a typical year: Prices rise in the spring -> prices settle in the summer -> prices rise in the fall -> prices settle in the winter.
This seasonality, combined with CREA’s admission that Greater Toronto has the ability to skew the national data set, points to a year where we’ll likely see volatility in house prices.
The remainder of cities fell below Greater Toronto in monthly growth in HPI, with the biggest price drops found in smaller Canadian cities and Ontario markets outside of the Greater Golden Horseshoe:
- Simcoe & District: -3.2 per cent
- Bancroft and Area: -2.4 per cent
- Regina: -2.1 per cent
- Windosr Essex: -2.6 per cent
- Victoria: -1.7 per cent
- Peterborough & the Kawarthas: -1.7 per cent
- St. John’s: -1.4 per cent
- Guelph & District: -1.3 per cent
- Kingston and Area: -1.2 per cent
- Prince Edward Island: -1.1 per cent
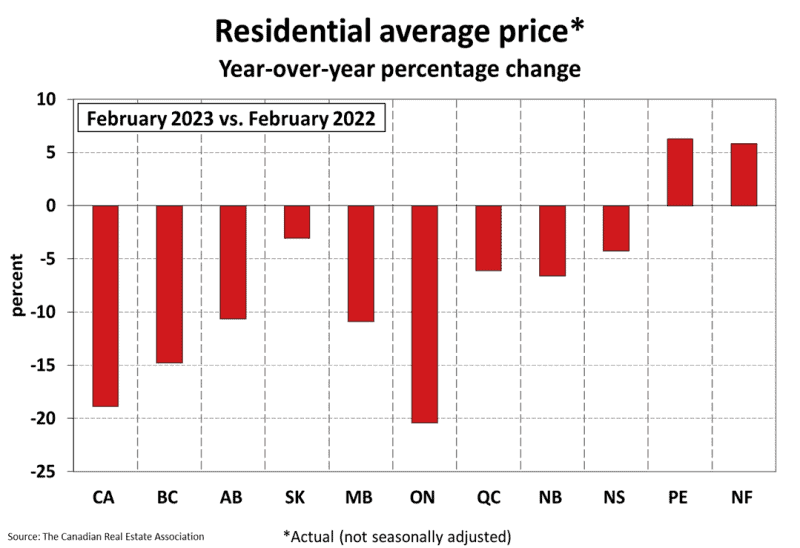
Interestingly, Prince Edward Island and Newfoundland & Labrador are the only two provinces where prices are still up year-over-year, so it’ll be interesting to see if their current downtrend pushes them to join the remainder of Canada in year-over-year declines.
Volume bouncing along the bottom
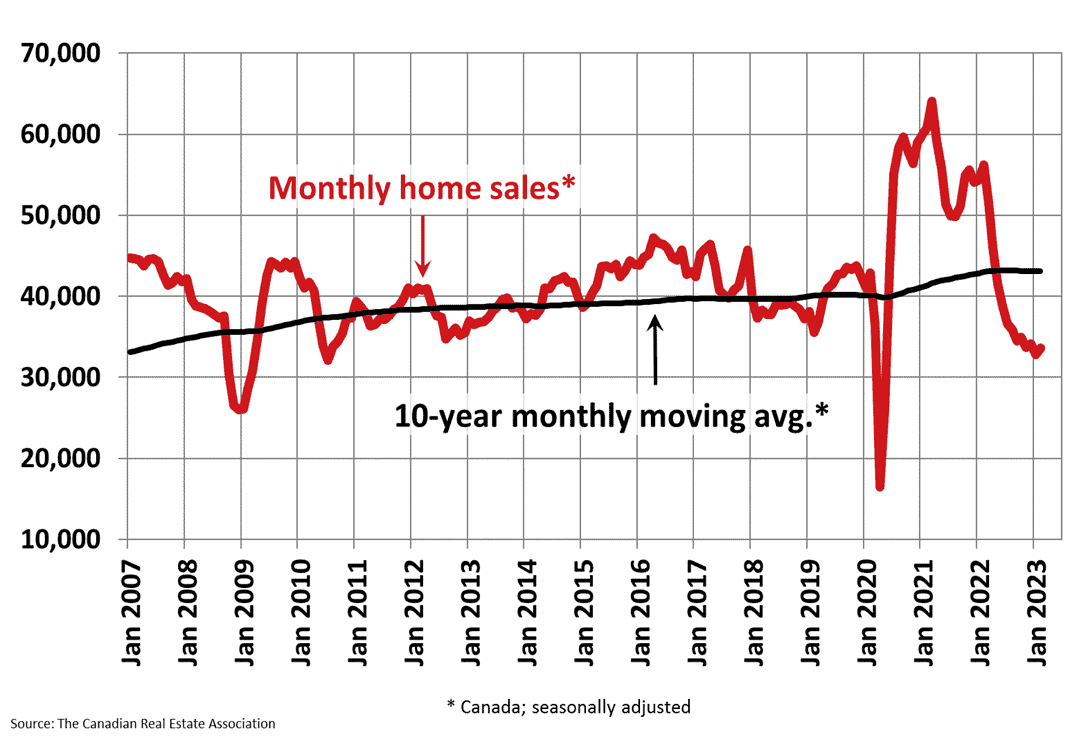
Another metric that finally seems to be breaking its negative trend is sales volume, or the number of homes sold. After many months of declines or meagre increases, home sales increased by 1.4 per cent from last month, the largest gain we’ve seen since these declines in volume started.
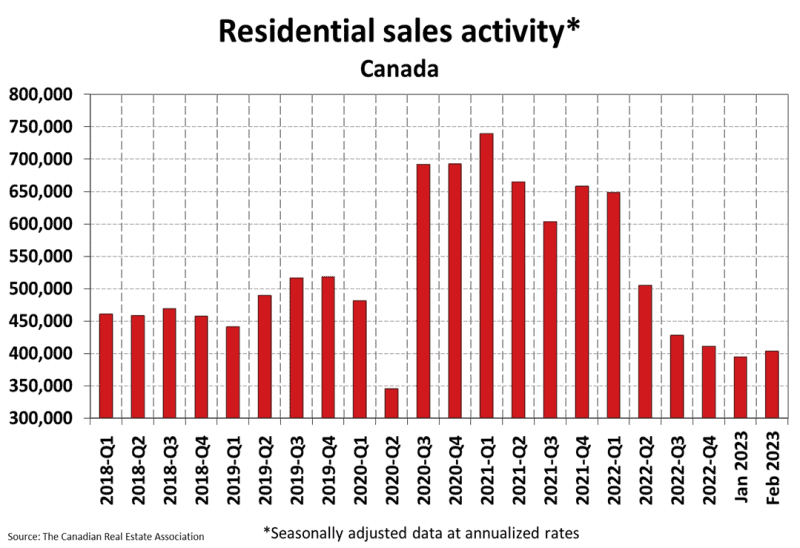
The real estate industry is likely breathing a sigh of relief after many months of record-low volume, which means reduced income from sales commissions.
The industry is also hopeful that we’ve moved onto an upward trend toward the 10-year monthly moving average of home sales. Historically, this uptrend in volume appears as a rebound from major drops visible in 2009, 2010, 2019 and 2020.
We know that while history doesn’t repeat itself, it often rhymes. Only time will tell if we’re due for a meaningful increase in volume that could pull the real estate industry out of a sustained period of low volume, but as it stands, volume is still down 34.4 per cent from last year’s lofty numbers.
The real estate market was running hot from the first pandemic-induced lockdown onward, trading significantly above the 10-year monthly moving average until February 2022.

Daniel Foch is the Chief Real Estate Officer at Valery.ca, and Host of Canada’s #1 real estate podcast. As co-founder of The Habistat, the onboard data science platform for TRREB & Proptx, he helped the real estate industry to become more transparent, using real-time housing market data to inform decision making for key stakeholders. With over 15 years of experience in the real estate industry, Daniel has advised a broad spectrum of real estate market participants, from 3 levels of government to some of Canada’s largest developers.
Daniel is a trusted voice in the Canadian real estate market, regularly contributing to media outlets such as The Wall Street Journal, CBC, Bloomberg, and The Globe and Mail. His expertise and balanced insights have earned him a dedicated audience of over 100,000 real estate investors across multiple social media platforms, where he shares primary research and market analysis.


