












Don’t miss out—join us online for REM’s monthly market breakdown on Dec. 23 at 2 PM ET. Columnist Daniel Foch will analyze CREA’s latest stats, regional variations and what shifting sentiment means for Realtors—register here.
What happens when a correction reaches the point where the market begins to rewrite its own rules? November data from the Toronto Regional Real Estate Board (TRREB) pushed that question to the forefront. The pattern that emerged shows the correction evolving into a more complex stage, nearly three years after it began. This recalibration is still working its way through the system, and its latest movements are exposing the forces that will shape the next chapter of the GTA housing cycle.
Sales fall while inventory rises
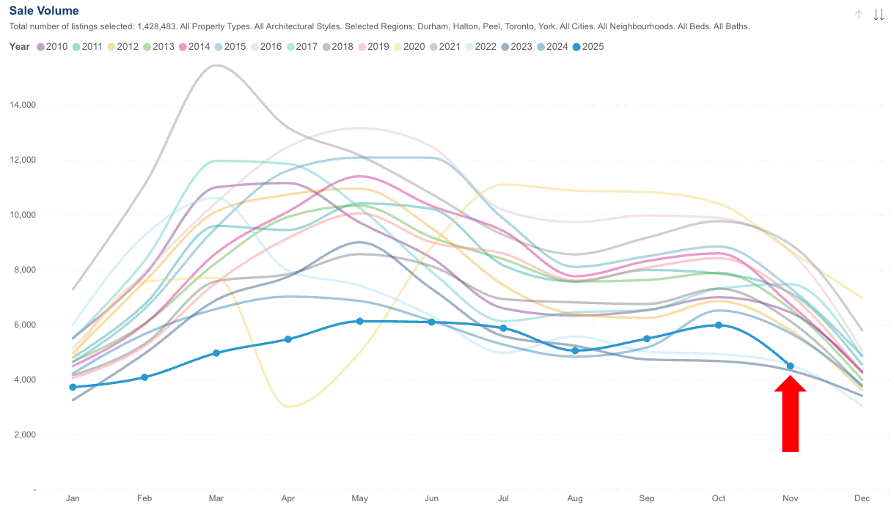
Home sales fell to almost 5,000 transactions in November, a drop of more than 15 per cent compared to last year. That made it the second slowest November on record, surpassed only by the period that followed the global financial crisis.
(Source: TRREB)
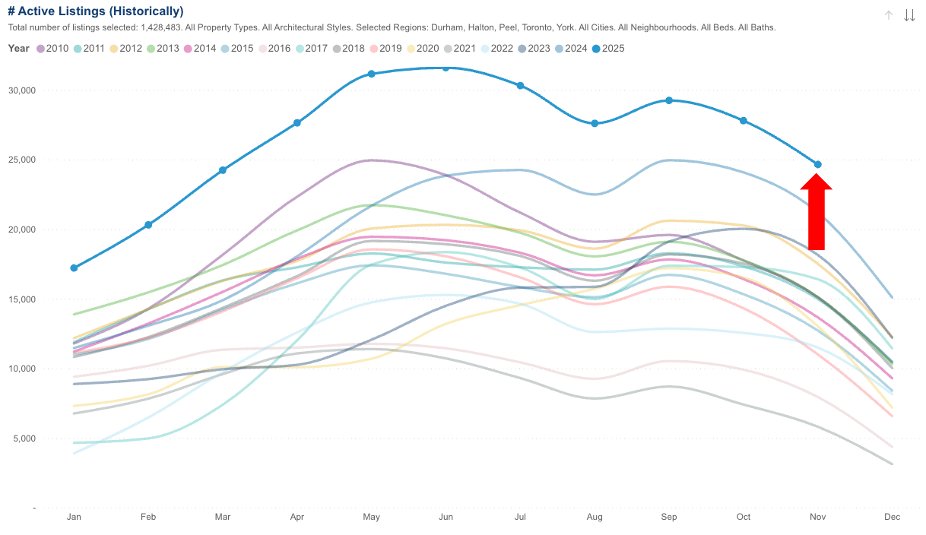
At the same time, active listings climbed to 24,549. That is the highest level ever recorded for a November in the GTA. Inventory has not been this high in more than a decade, and the increase is outpacing the decline in new listings, which fell only four per cent year over year. When sales fall faster than supply, the market drifts downward. That is exactly what the data shows.
(Source: TRREB)
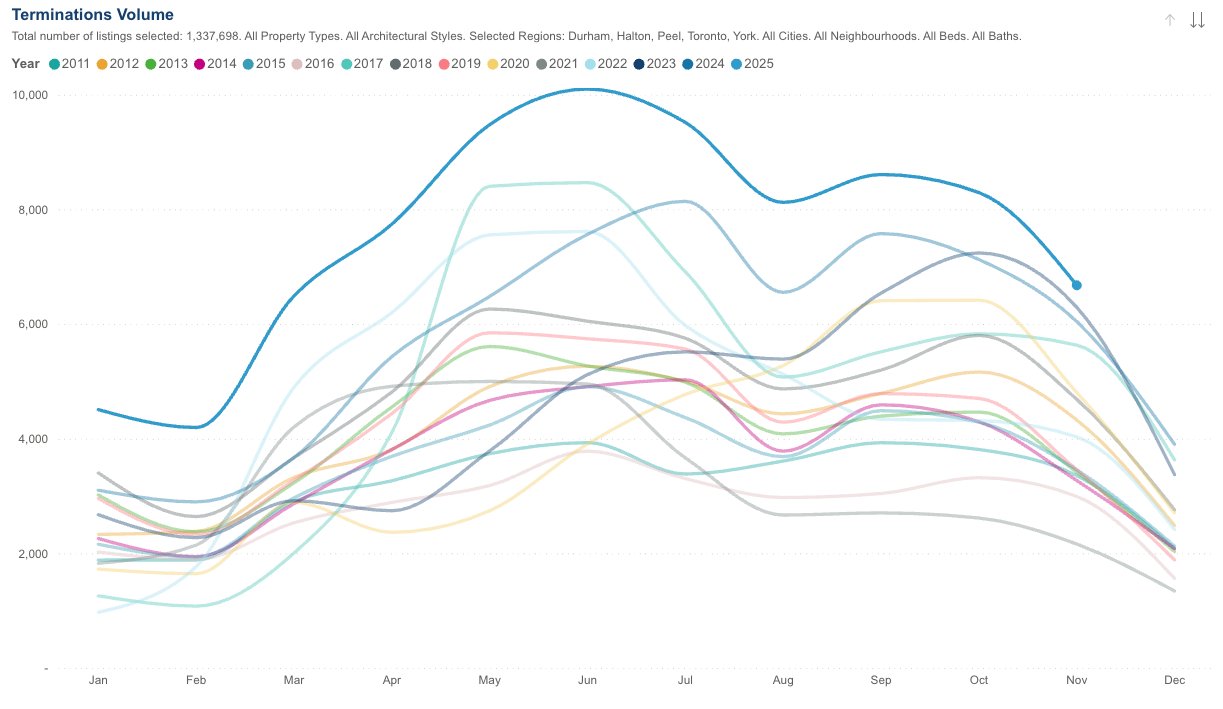
There is another signal underneath the headline numbers. November recorded the highest number of terminations ever reported for this month. When sellers terminate listings in November, they often intend to return in the spring. This creates a layer of pent-up supply that does not appear in the active listing count yet still shapes the pressure building beneath the surface.
(Source: TRREB)
Prices move on a controlled downward path
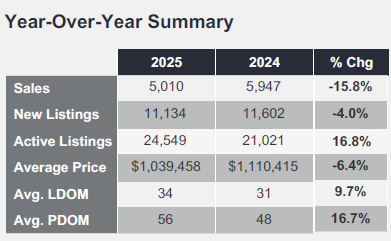
The average selling price moved to $1,039,458 in November. That reflects a year-over-year drop of more than six per cent. The MLS Home Price Index shows a similar decline of almost six per cent. These are not dramatic numbers on their own, yet they matter because they confirm a trend that has been in place since the peak of early 2022. Month-to-month changes were almost flat, which suggests that the shift is steady rather than volatile. Corrections often look like this. They are less about sudden shocks and more about the slow, grinding return of balance.
(Source: TRREB)
Detached homes become the weakest segment
The most surprising part of the November data is how uneven the correction has become. Detached homes are now the weakest segment in the region. Prices for detached properties fell by eight per cent year over year, and both the city and the suburbs are following the same pattern. This is not the behaviour people expect when the market softens. Detached homes are often seen as the most resilient part of the housing ladder. Instead, they are absorbing some of the largest declines.
Downtown condos show early price stability (in 416)
The opposite is happening in the downtown condominium market. Prices for a typical condo in the city fell only 1.7 per cent year over year. Sales volumes are down, but the price resilience is clear. This is the second consecutive month in which the core condo segment showed this pattern. It mirrors what happened in the early 1990s when condos led the decline, but also reached their floor earlier than low-rise homes.
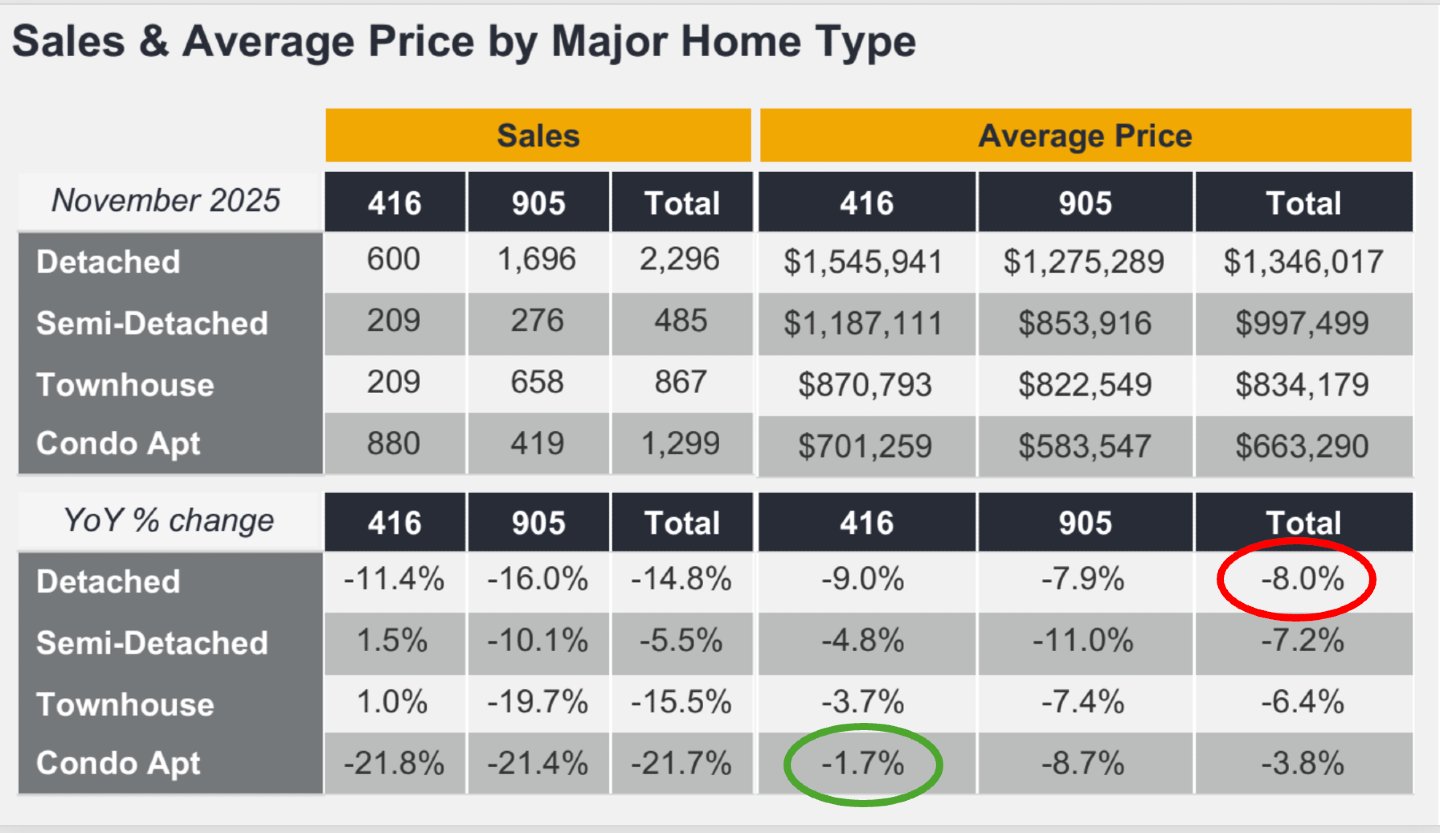
(Source: TRREB)
Why the core of Toronto is diverging
Part of the explanation lies in the way people are using the city again. Office towers are filling at a faster pace than they were a year ago. Hybrid work is still here, but the return to office trend is stronger than many expected. The city is regaining some of the gravitational pull it lost during the pandemic. Commute times matter again. Proximity matters again. The resurgence of downtown life is not a headline-grabbing surge, but it is a steady rebalancing that supports the core condo market.
The supply side of the condo market is also becoming more visible. Active condo listings for sale have been at record levels for 19 consecutive months (shown in the chart below), and rental listings are approaching record highs for November outside the pandemic period. Investor-owned units are spending more time on the rental market, which shows that the flow of supply is expanding even as prices in the core remain relatively steady. This combination reflects a market that is rediscovering downtown utility while still working through the excesses of the last cycle.
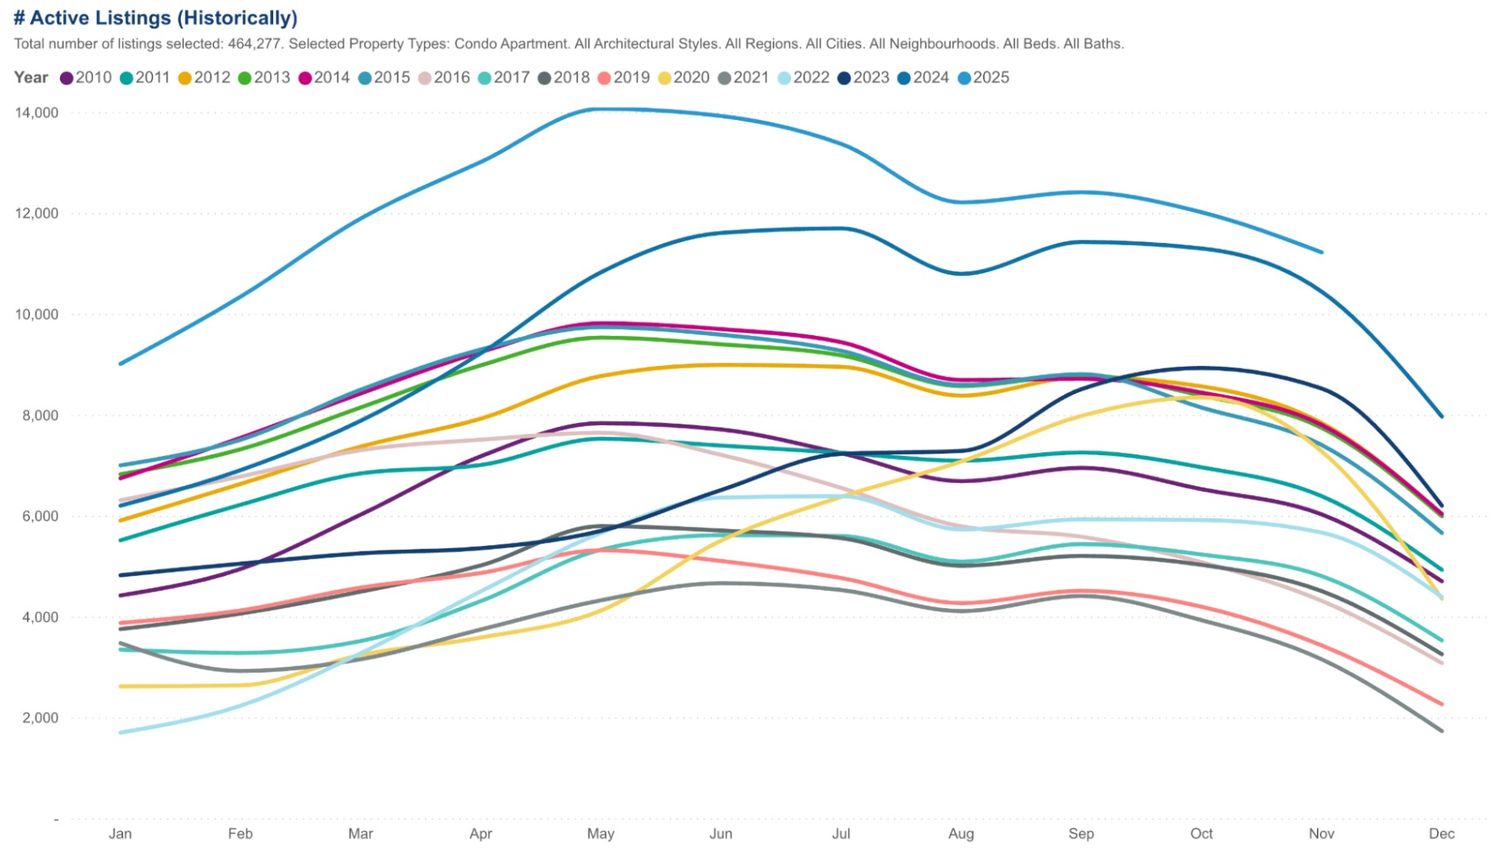
(Source: TRREB)
Structural supply pressures beneath the surface
Estate and POA listings add a new layer of supply
The November data also shows how demographic change is shaping supply. Listings associated with estates and power of attorney are now 10 per cent higher than last year. They are 78 per cent higher than they were a decade ago. That is not a cyclical phenomenon. That is a structural one. Aging homeowners are entering stages of life where properties transition through estates or long-term care planning. This creates a growing layer of supply that becomes more visible during slower markets. It is one of the reasons inventory is rising faster than demand can absorb it.
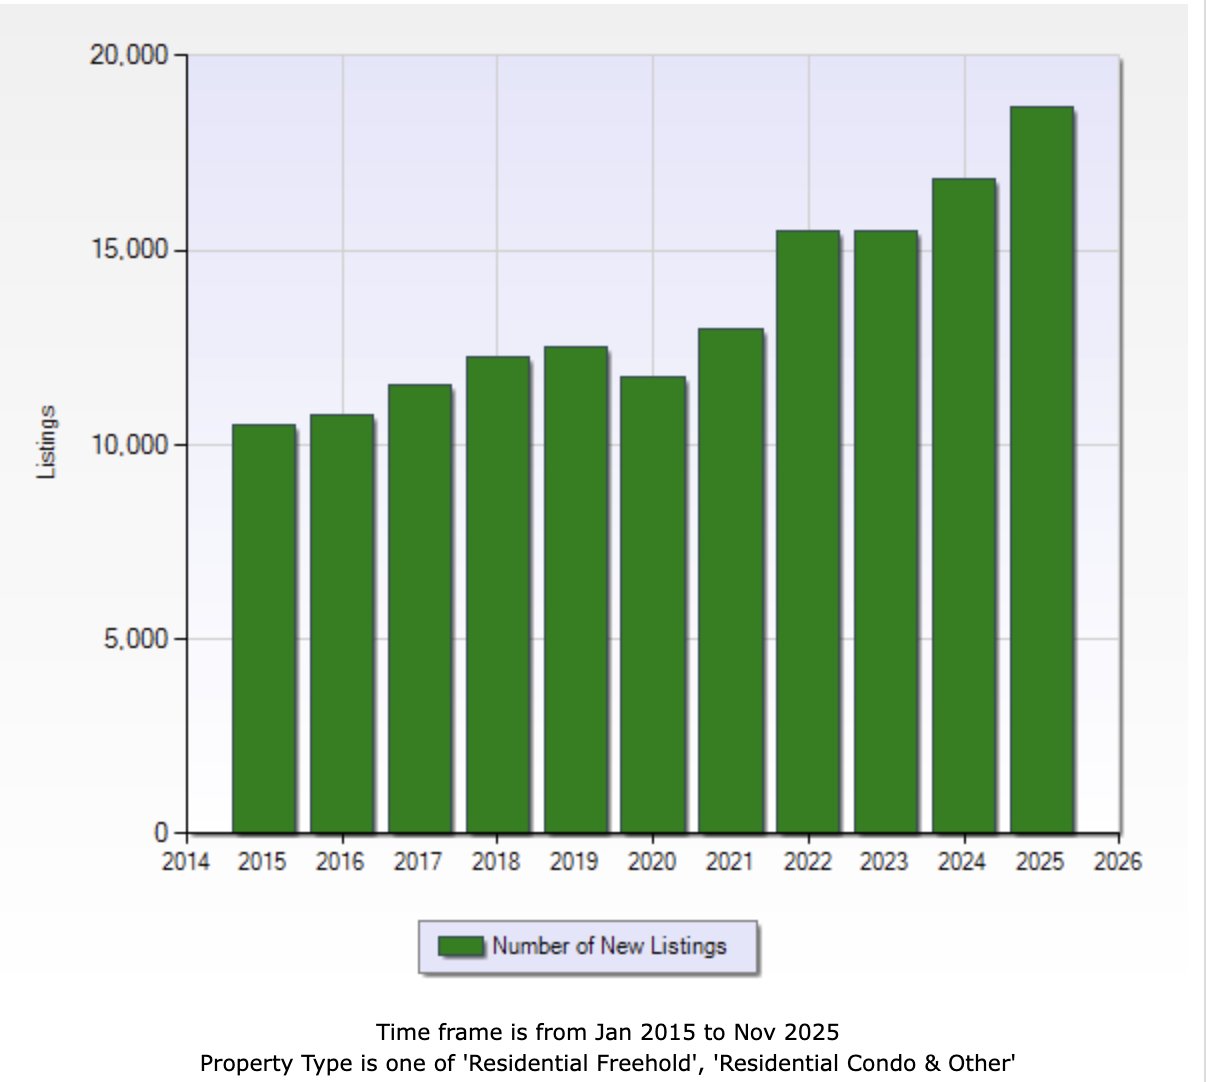
(Source: @JonFlynnREstats on X)
Days on market reflect the reset
Days on market reflect the slower pace of activity. The average listing spent 34 days on the market in November. The property days on market measure reached 56 days. These figures confirm that homes are taking longer to sell, although they remain within the bounds of historical norms for softer markets.
The months of inventory trend adds another dimension. The rolling three-month average remains in a high channel, which reflects the volume of listings that remain unabsorbed even as the homes that do sell are moving at a pace consistent with long-term patterns.
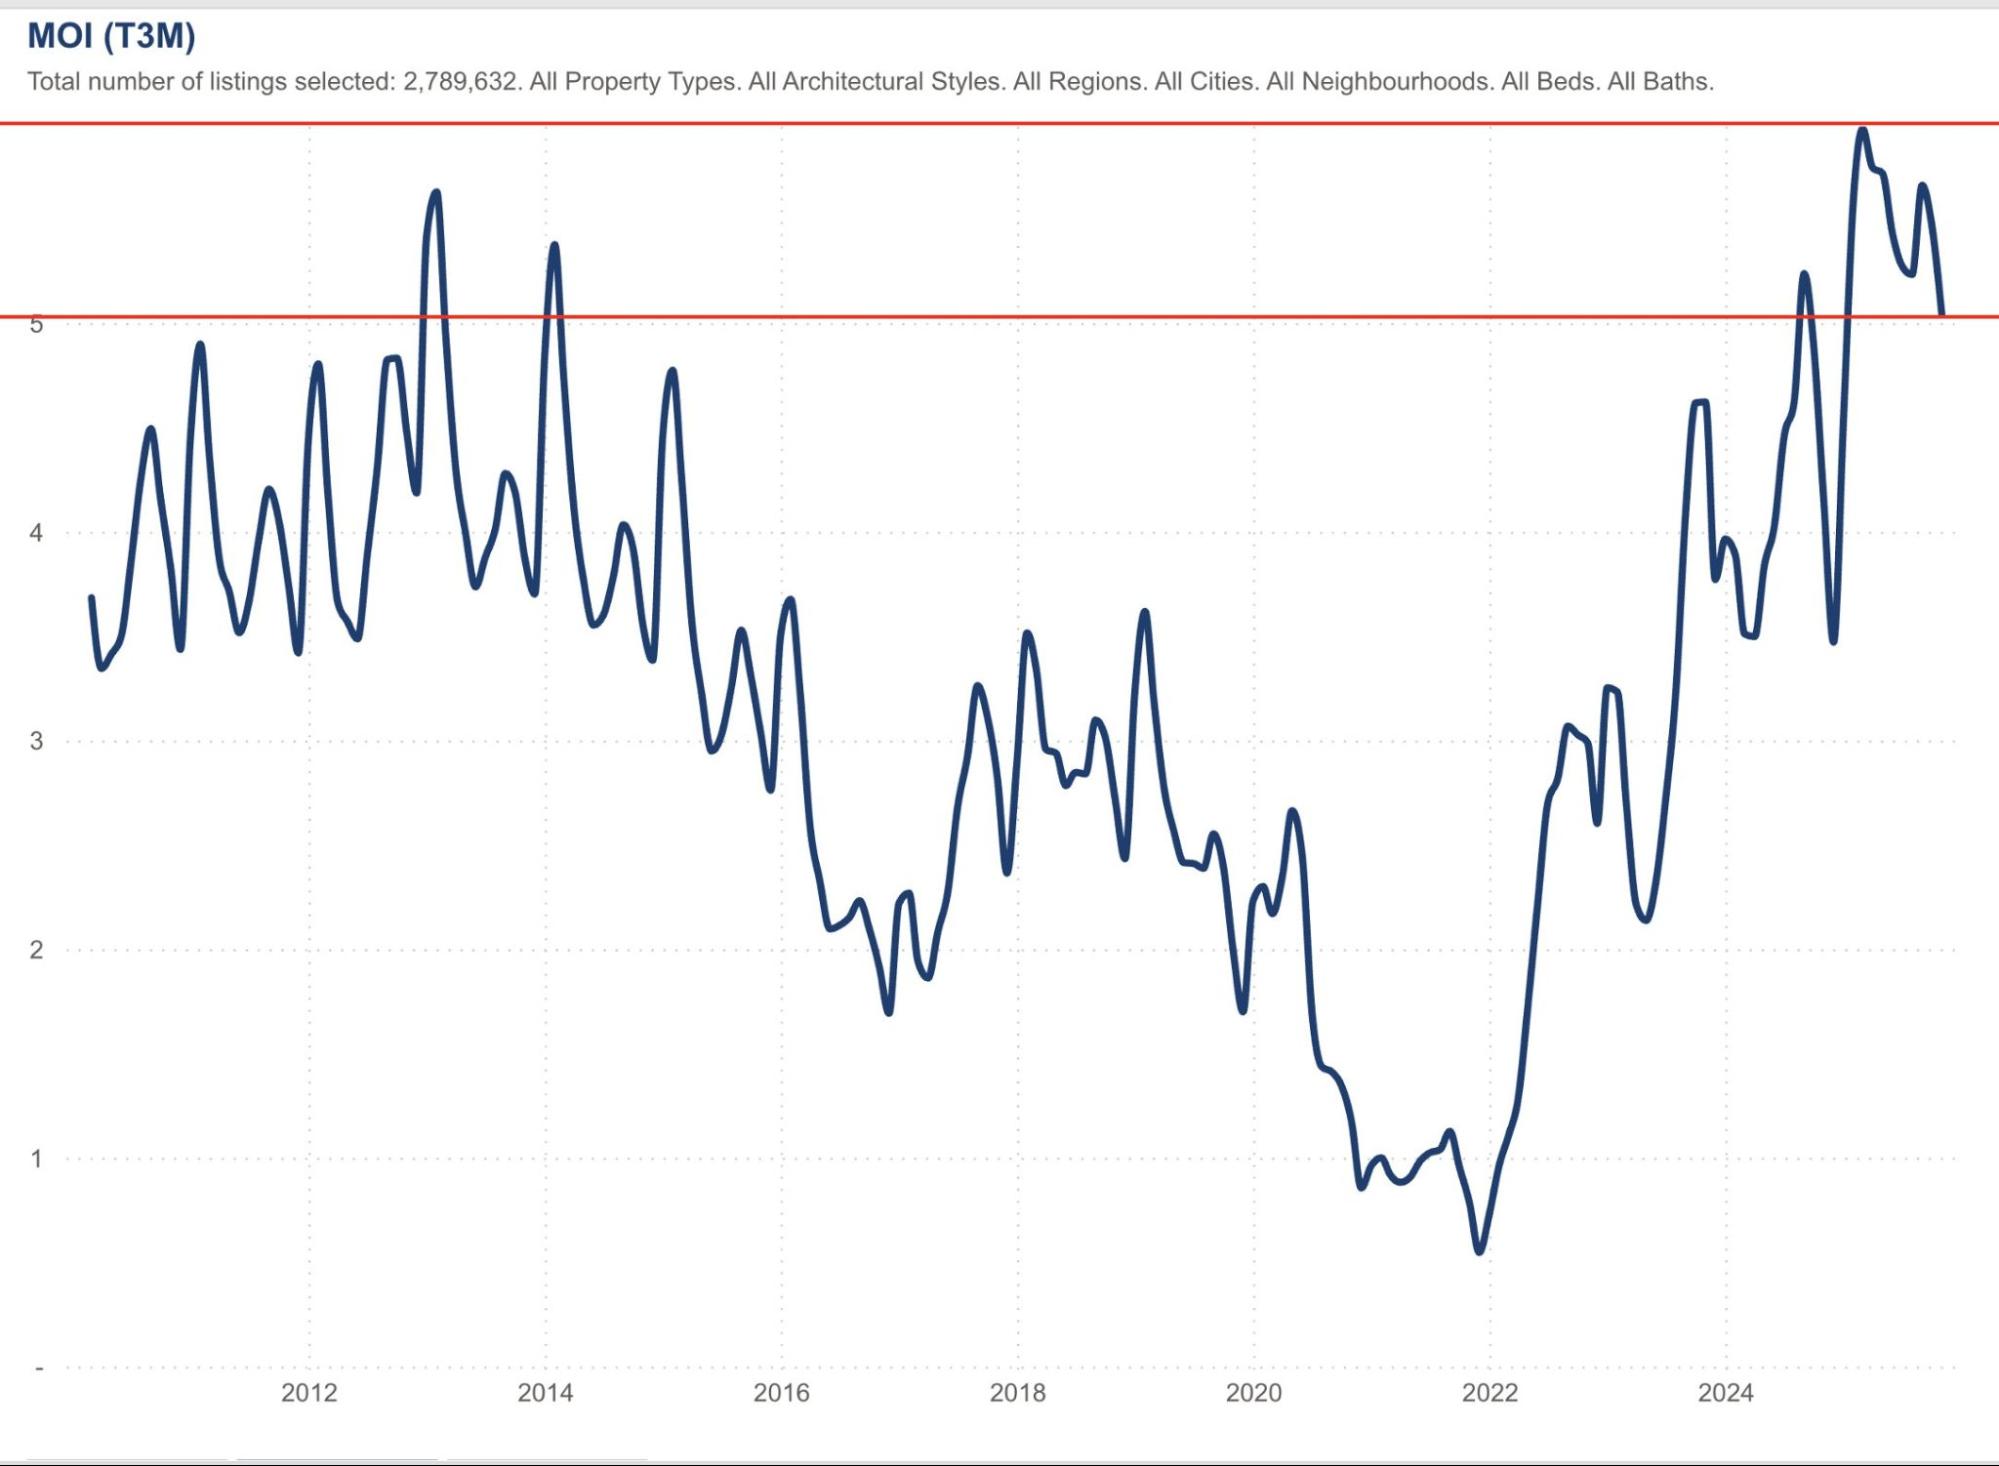
(Source: TRREB)
The road to 2026
The broader economic context is a mix of caution and early signs of improvement. Employment data for November surprised on the upside. Economic growth indicators were stronger than anticipated. These signals matter because housing demand depends heavily on job confidence. Many potential buyers want to take advantage of lower borrowing costs and softer home prices, yet hesitate without clarity on their long-term employment prospects.
The correction is also beginning to resemble the long cycles that shape every major housing downturn. When I compared this cycle with the corrections that began in 1989, 2007 and 2022, the similarity was unmistakable. Corrections progress through stages. The GTA is in the stage where inventory builds, sales slow and different product types move along different paths.
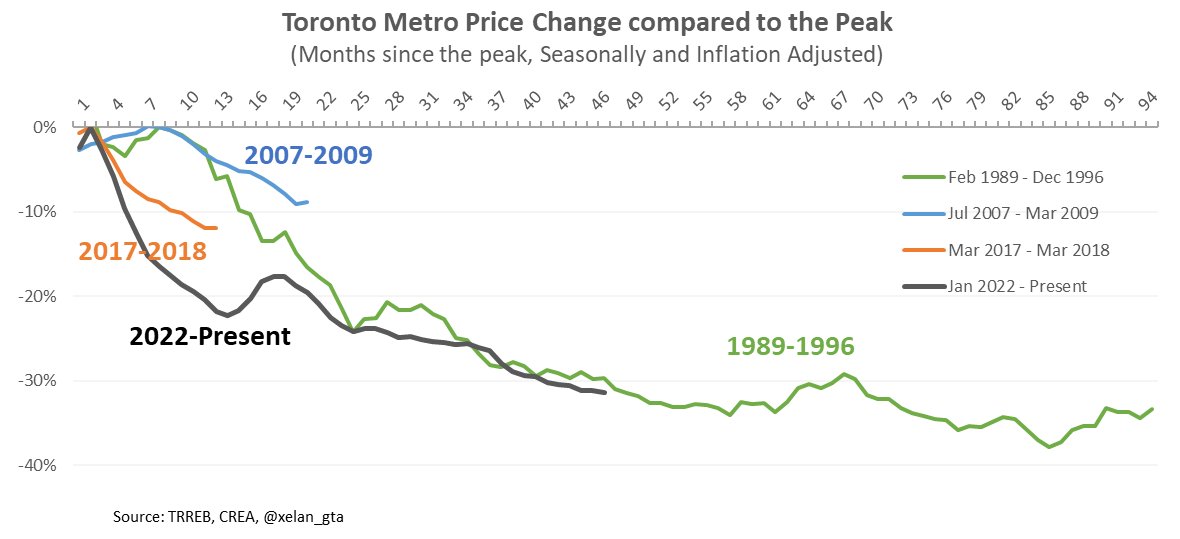
(Source: @xelan_gta on X)
Strategic implications
Buyers
Detached homes now offer more choice, deeper value, and stronger negotiating conditions than at any time since before the pandemic.
Sellers
Pricing discipline and patience matter again. Days on market reflect a relatively normal market rhythm when compared to the extreme pace of the last cycle.
Investors
The downtown rental engine is helping stabilise the core. Early recovery signals often begin in locations where employment and transit intersect.
Final thought
The November data marks a deeper and more revealing stage of the housing correction underway. The market is moving through the same rhythm that shaped previous downturns. The details are different, but the cycle is familiar. The search for balance continues, and the signals hidden inside the data point to where that balance may eventually emerge.



Daniel Foch is the Chief Real Estate Officer at Valery.ca, and Host of Canada’s #1 real estate podcast. As co-founder of The Habistat, the onboard data science platform for TRREB & Proptx, he helped the real estate industry to become more transparent, using real-time housing market data to inform decision making for key stakeholders. With over 15 years of experience in the real estate industry, Daniel has advised a broad spectrum of real estate market participants, from 3 levels of government to some of Canada’s largest developers.
Daniel is a trusted voice in the Canadian real estate market, regularly contributing to media outlets such as The Wall Street Journal, CBC, Bloomberg, and The Globe and Mail. His expertise and balanced insights have earned him a dedicated audience of over 100,000 real estate investors across multiple social media platforms, where he shares primary research and market analysis.




5010 is the 24th best of last 30 … but if First-Time buyers and investors (formerly ~half of market)are on the sidelines – what can be expected in an early-snow November?
416 IS doing much better than the outlying zone but 60% of the sales are typically IN 905 and the Market Watch ‘weights’ the average price .
Too early to say the sky is falling.
Flat is the new Up